The Details drop zone is used to add multiple member hierarchies to scatter, advanced (except Sankey and Word), and bubble map charts. When working with these charts, the first hierarchy is added to the Color drop zone; this hierarchy will drive the color of the visualization. Any additional hierarchies are added to the Details drop zone; they will not drive the color of the chart, but will be colored according to the hierarchy in the Color zone. They will also drive the segmentation for advanced charts and bubble map charts.
This is a useful way to display hierarchical data, but you may also choose to present non-hierarchical data in this way if you want to see the relationship between the specified hierarchies.
Add Details
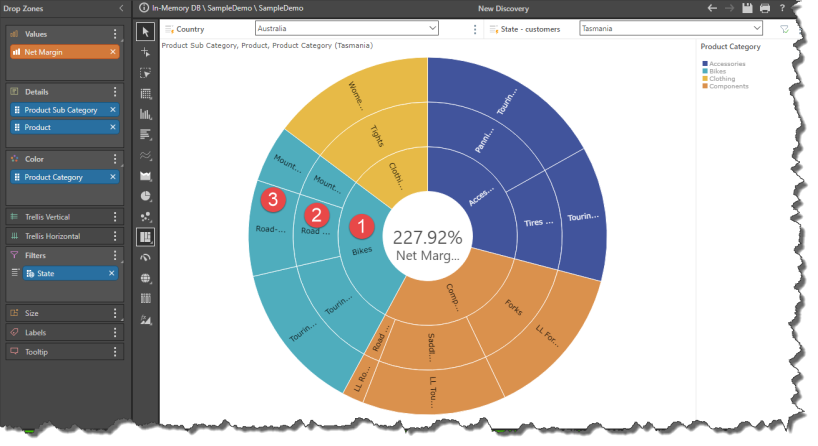
Measures cannot be added to the Details drop zone; the Details zone supports blue chips only. After adding the first hierarchy to the Color zone, add one or more hierarchies to Details. In the Sunburst chart below, the Product Category hierarchy was added to the Color zone; this hierarchy is represented by the innermost ring in the chart (labeled "1" in the image below).
The topmost hierarchy in the Details zone is Product Subcategory, which is represented by the second ring in the chart ("2"). A third hierarchy, Product, was also added to the Details zone, and is represented by the third ring in the chart ("3"). The color of the second and third hierarchies is driven by the hierarchy in the Color zone, making it easy to identify to which category each segment belongs.
The query was defined further by added a cascading slicer enabling the user to filter by state.
Non Hierarchical Details
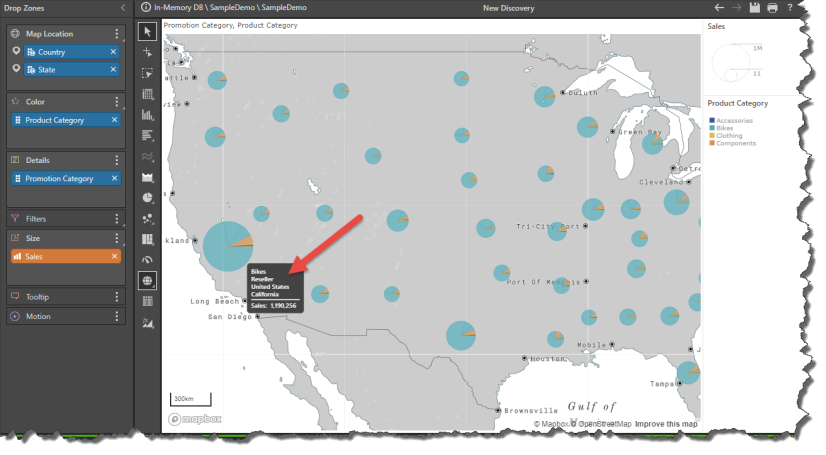
Although the Details zone is helpful in visualizing hierarchical data, it can also be useful in understanding relationships between non-hierarchical data. The bubble map below displays Net Margin by State and Product Category. The size of bubble is driven by the Sales measure, while the color is driven by the Product Category hierarchy.
The segmentation of each bubble is driven by the Promotion Category hierarchy, which was added to the Details zone. Each hierarchy is listed in the tooltip for each data point.
Detail Labels
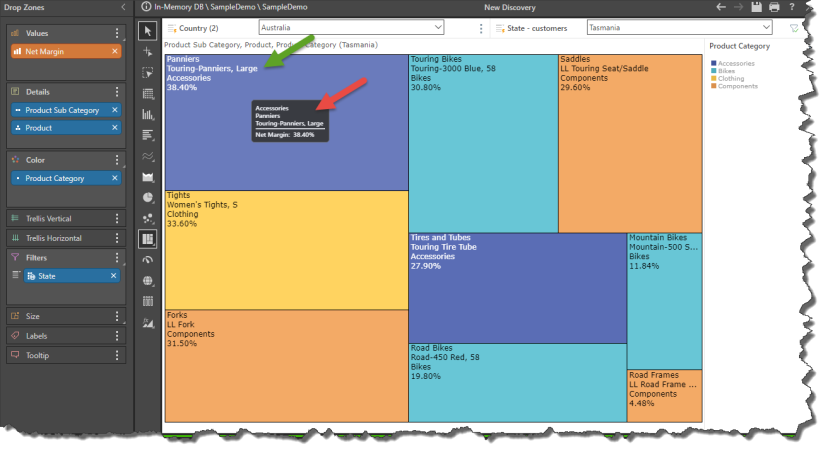
To display the Details chips as labels in the chart, be sure to enable data labels from the Component ribbon. Note that the behavior of the labels differs according to the chart type. For instance, in the Tree Map below, each hierarchy is labeled in each data point, in order of their position in the drop zones. The tooltip displays them in their hierarchical order.
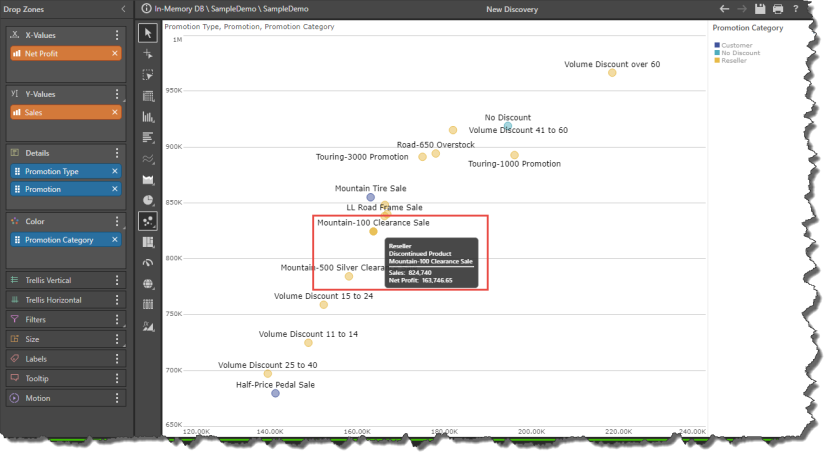
Scatter Charts display the labels of the last hierarchy in the Details zone for each data point, while the tooltip displays each label in the hierarchical order.
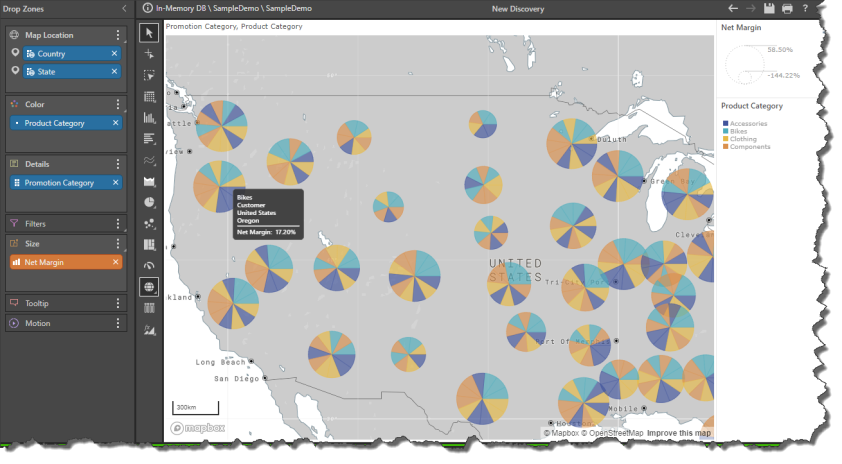
Bubble maps don't support labels, so the hierarchies are listed in the tooltip for each data point: